Free Revenue-Leak Review - we analyze your billing export and show you exactly where revenue is leaking.Claim yours →
HIPAA CompliantAAPC Certified264+ Revenue Audits
Sample Audit · De-identified

From One Billing Export to a Complete Revenue Diagnosis

A practice sent us a single billing-system export — $356,208 across 2,603 claim lines. Our analysis engine returned this 10-section executive audit. Below: the key findings, then the actual report pages.

1

You send one export

Aging report, denial report or claim dump — straight from your billing software.

2

We run the diagnostics

KPIs, AR aging, payer yield, denial forensics, backlog and benchmark scoring.

3

You get the action plan

Every leak ranked by recoverable dollars, with the fixes sequenced.

4

We recover it (optional)

Bring us in for recovery at 5% of collections or 15% contingency on old AR.

Figures below are from a real, de-identified client engagement — shown with permission. They reflect that practice's performance at audit time, not Zaxis benchmarks.
Section 1 · Executive KPI Dashboard

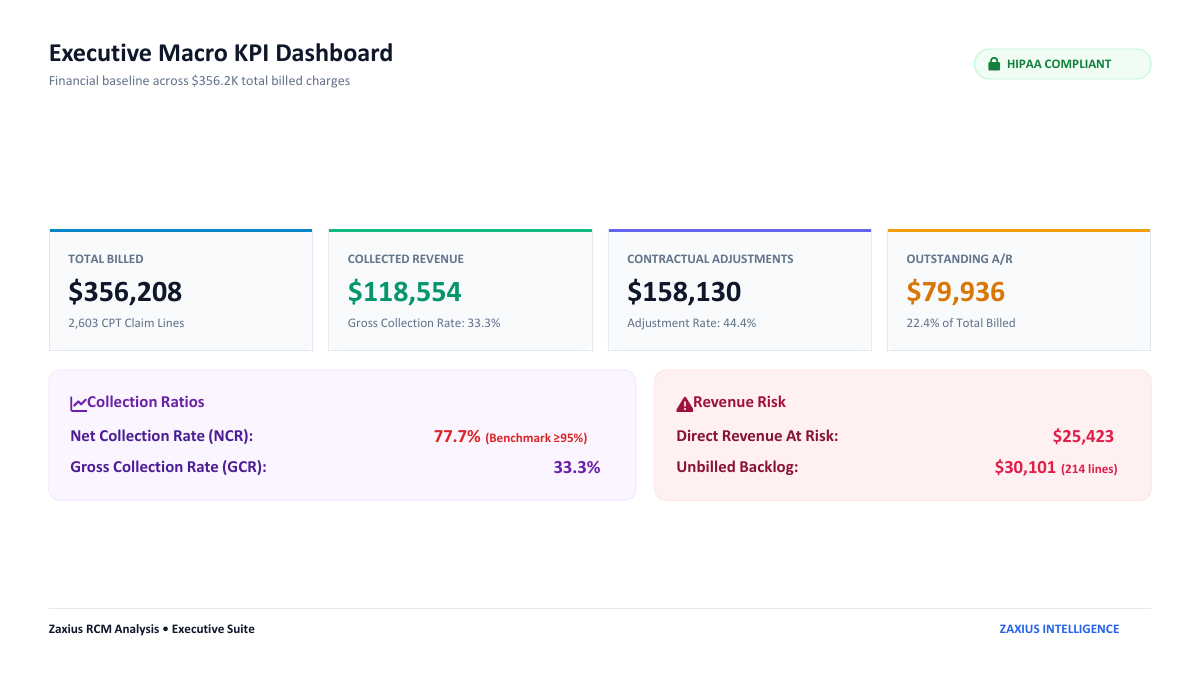
The Financial Baseline in One View

Total billed, collected revenue, adjustments and open AR — with collection ratios measured against benchmark.

Total Billed$356,2082,603 CPT claim lines
Collected Revenue$118,554Gross collection rate: 33.3%
Net Collection Rate77.7%Benchmark ≥ 95% — critical gap
Outstanding A/R$79,93622.4% of total billed
Section 2 · A/R Aging & Timely Filing Risk

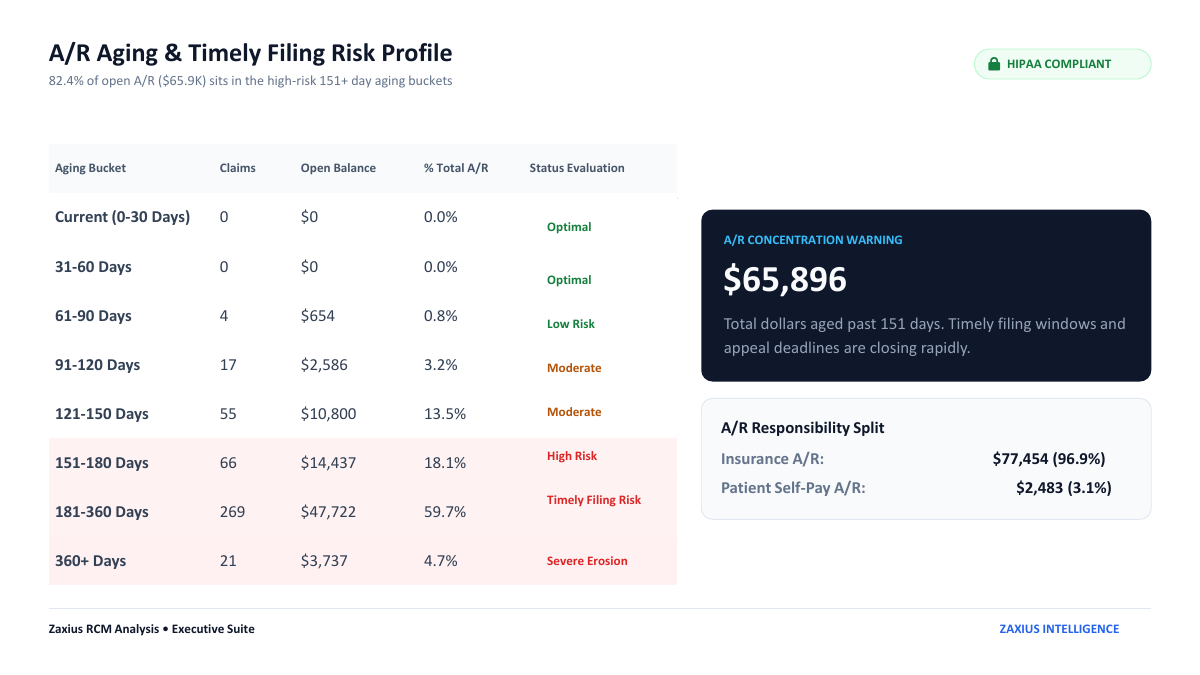
82.4% of Open A/R Sits Past 151 Days

Aging buckets reveal timely-filing windows closing fast — $65,896 in the high-risk zone.

61–90 days
$654 · 0.8%
91–120 days
$2,586 · 3.2%
121–150 days
$10,800 · 13.5%
151–180 days
$14,437 · 18.1%
181–360 days
$47,722 · 59.7%
360+ days
$3,737 · 4.7%
Section 3 · Payer Performance Matrix

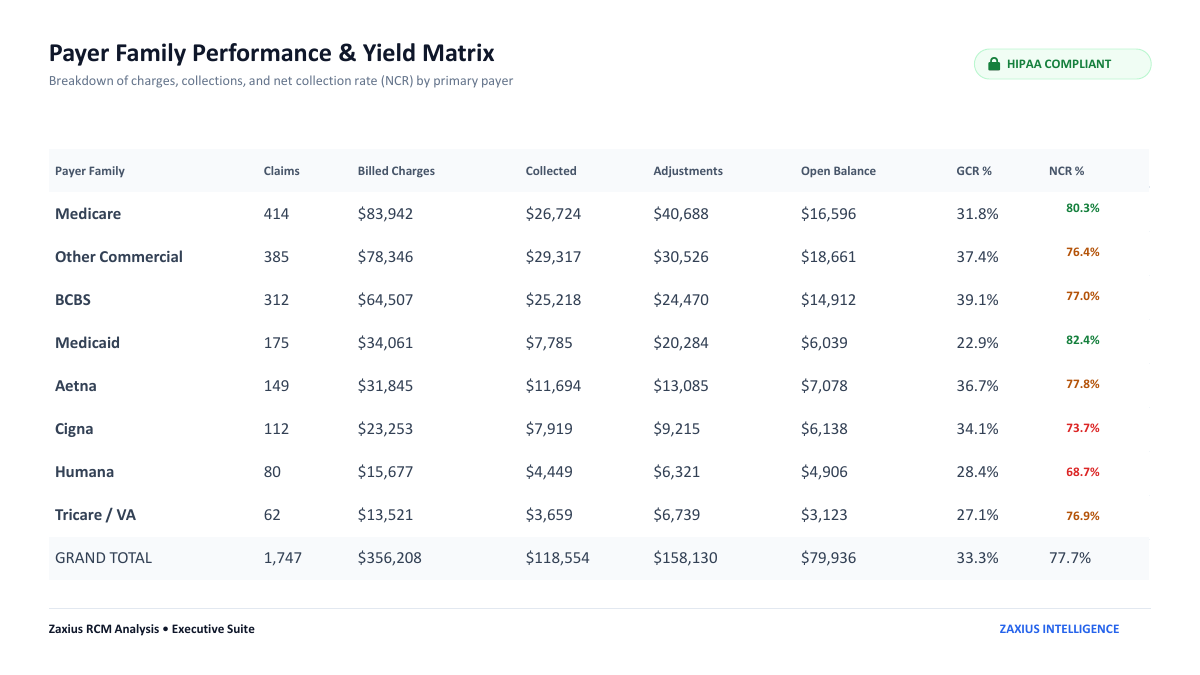
Which Payers Pay — and Which Don't

Charges, collections and net collection rate by payer family. Medicaid at 22.9% GCR was the worst yield in this portfolio.

PayerClaimsBilledCollectedGCR
Medicare414$83,942$26,72431.8%
Other Commercial385$78,346$29,31737.4%
BCBS312$64,507$25,21839.1%
Medicaid175$34,061$7,78522.9%
Aetna149$31,845$11,69436.7%
Cigna112$23,253$7,91934.1%
Sections 4–5 · Risk Model & Denial Forensics

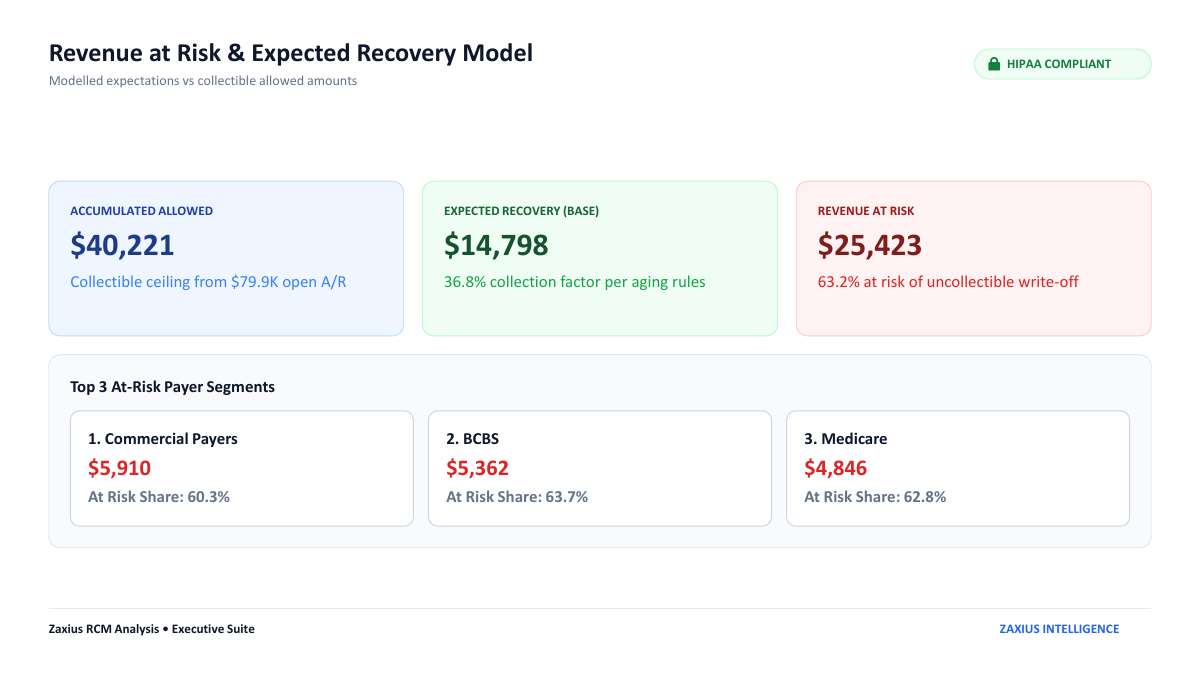
$25,423 at Risk. 349 Denied Lines.

Expected-recovery modeling meets CARC-level denial diagnostics.

Collectible Allowed

$40,221

Ceiling from $79.9K open A/R

Expected Recovery

$14,798

Base case at 36.8% collection factor

Revenue at Risk

$25,423

63.2% at risk of write-off

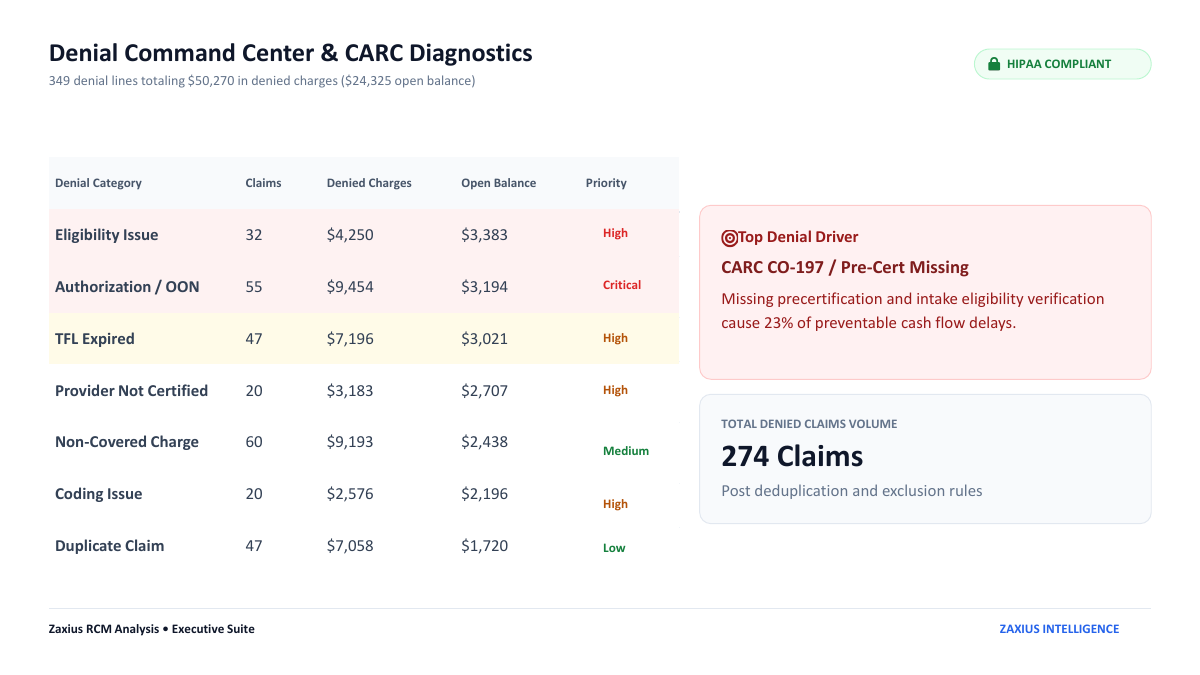
Denial categories by denied charges

Authorization / OON
$9,454 · 55 lines
Non-covered charges
$9,193 · 60 lines
Timely filing expired
$7,196 · 47 lines
Duplicate claim
$7,058 · 47 lines
Eligibility issues
$4,250 · 32 lines
Provider not certified
$3,183 · 20 lines
Coding issues
$2,576 · 20 lines
Top denial driver: CARC CO-197 (pre-cert missing). Missing precertification and intake eligibility verification caused 23% of preventable cash-flow delays.
Sections 6–10 · Backlog, Yield, Benchmarks, Plan

From Diagnosis to Action Plan

Every audit closes with backlog triage, CPT yield, benchmark scoring and a sequenced recovery plan.

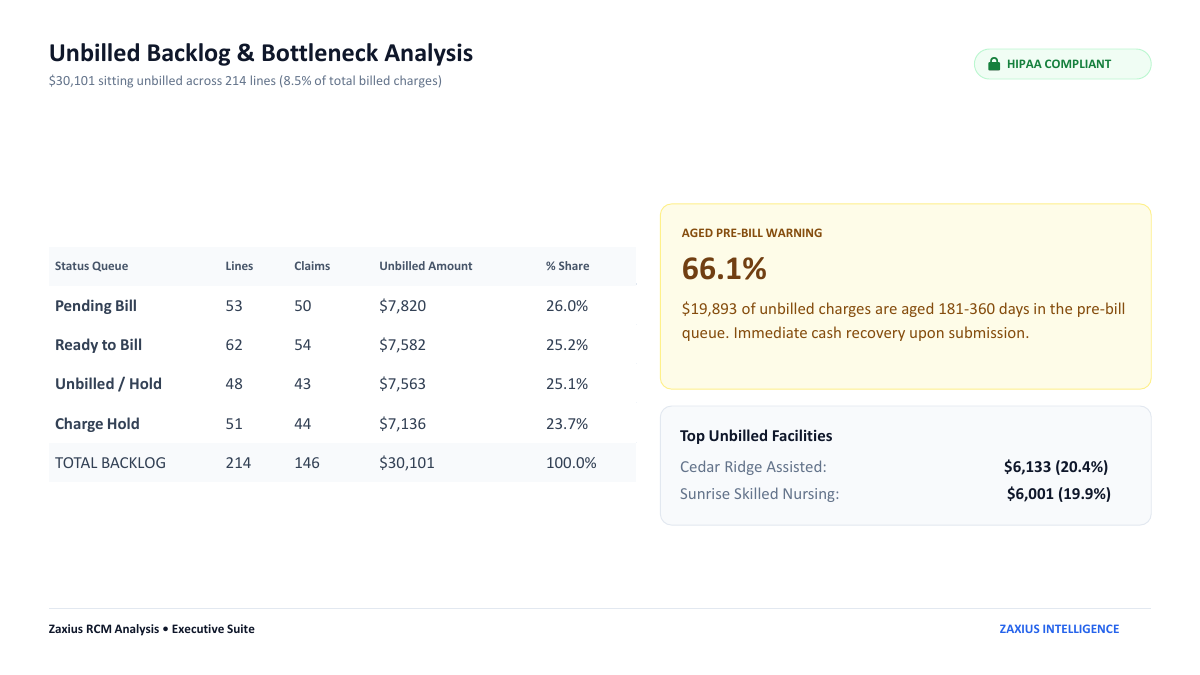
$30,101 Unbilled Backlog

214 claim lines trapped in pre-bill queues — 66% aged over 180 days. Immediate cash recovery upon submission.

QueueLinesAmount
Pending bill53$7,820
Ready to bill62$7,582
Unbilled / hold48$7,563
Charge hold51$7,136

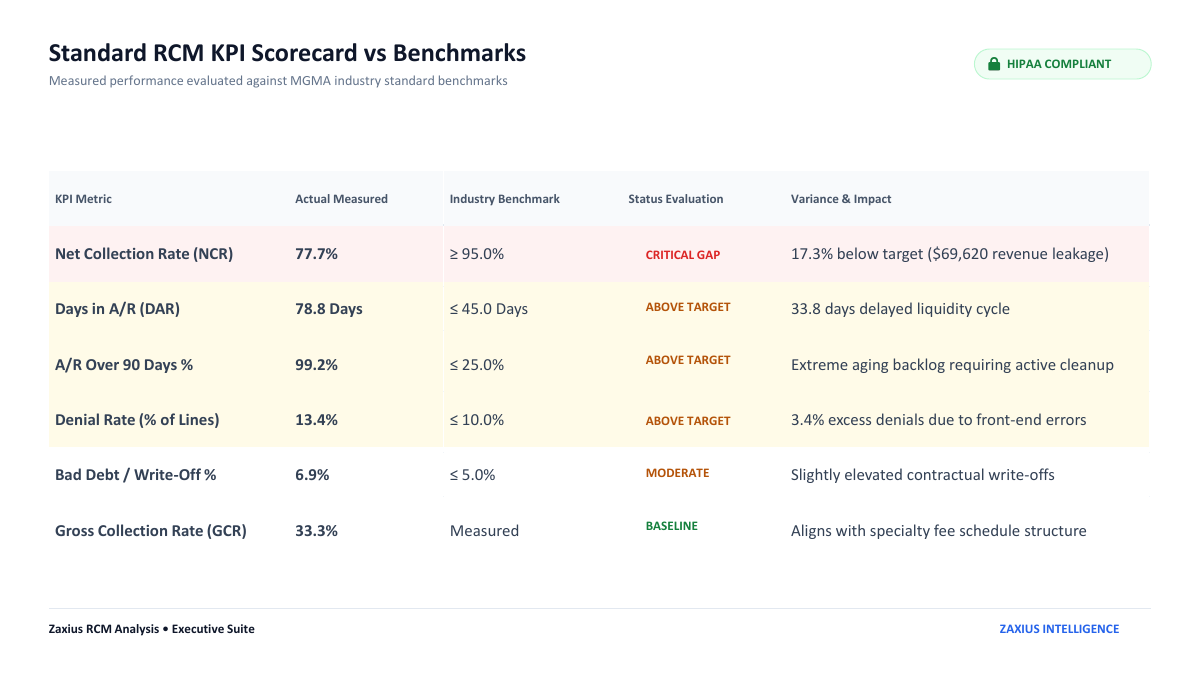
KPI Scorecard vs MGMA Benchmarks

KPIActualBenchmarkStatus
Net collection rate77.7%≥ 95%Critical gap
Days in A/R78.8≤ 45Above target
A/R over 90 days99.2%≤ 25%Above target
Denial rate13.4%≤ 10%Above target
Write-off %6.9%≤ 5%Moderate

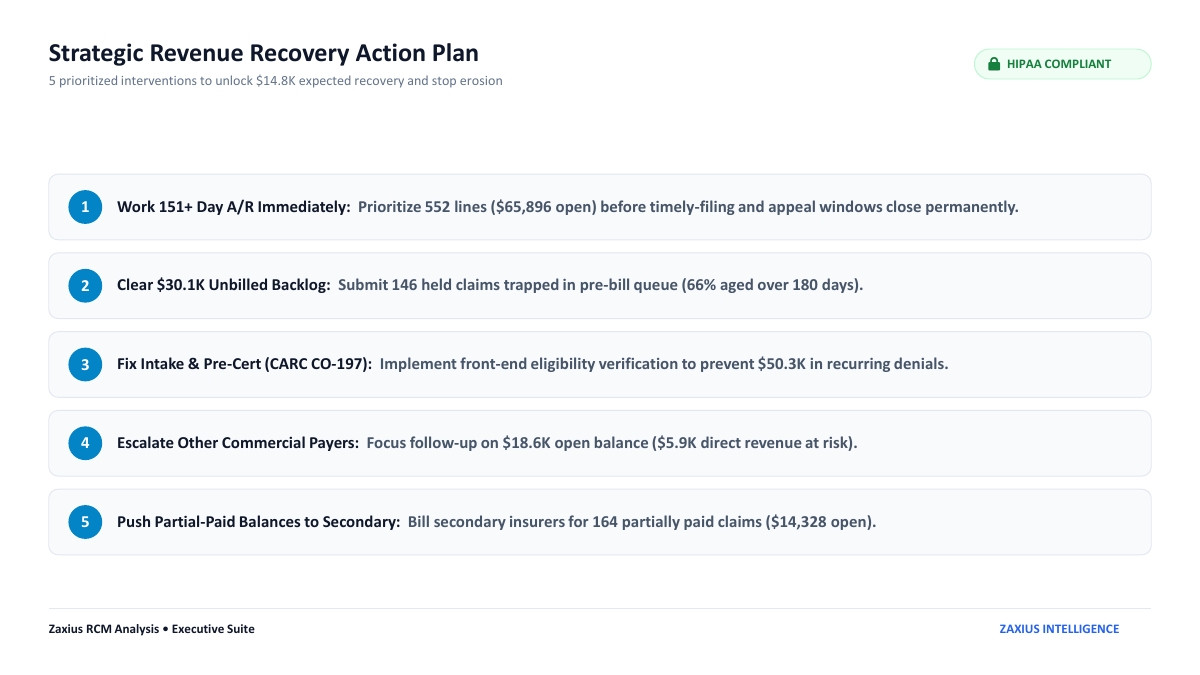
The 5-step recovery plan we delivered

1

Work 151+ day A/R

Prioritize 552 lines ($65,896) before filing windows close.

2

Clear $30.1K backlog

Submit 146 held claims trapped pre-bill.

3

Fix intake & pre-cert

Front-end eligibility checks to stop CO-197 denials.

4

Escalate commercial payers

Focus follow-up on $18.6K open balance.

5

Bill secondary

Push 164 partial-paid claims ($14,328) to secondary.

The actual report

Browse the Full 12-Page Analysis

Every section above comes from these report pages — generated from that single billing export.

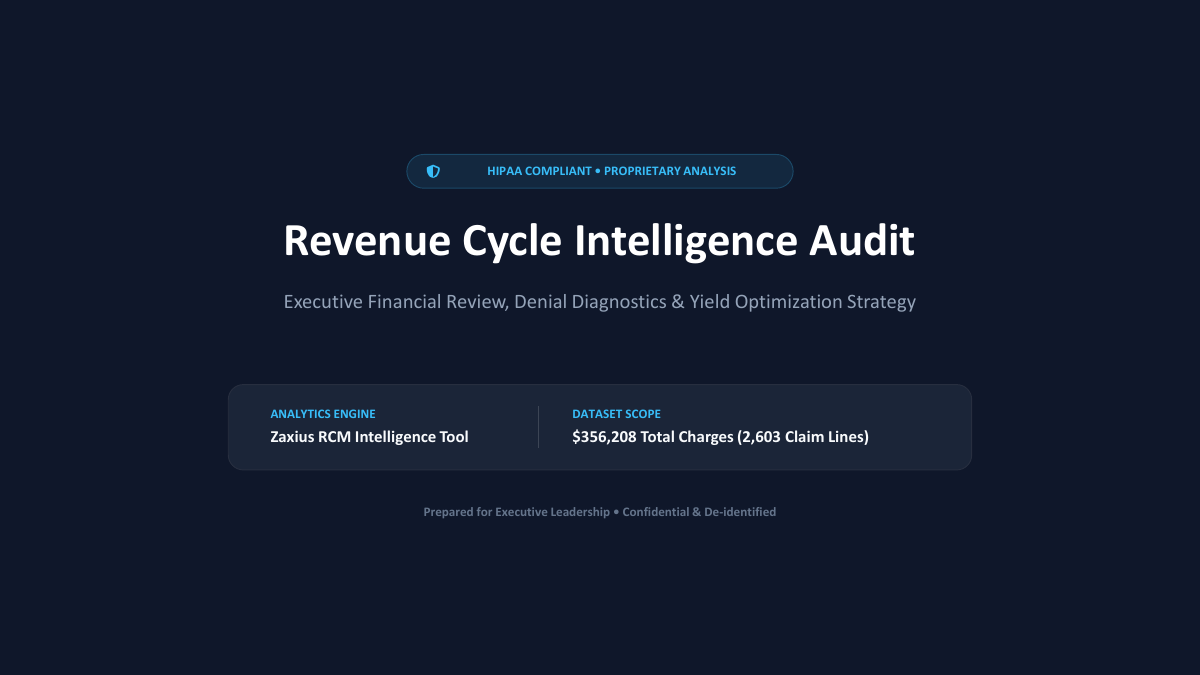
Sample RCM audit report page: Cover - Executive Revenue Audit
Cover - Executive Revenue Audit
Sample RCM audit report page: Executive Macro KPI Dashboard
Executive Macro KPI Dashboard
Sample RCM audit report page: A/R Aging & Timely Filing Risk Profile
A/R Aging & Timely Filing Risk Profile
Sample RCM audit report page: Payer Family Performance & Yield Matrix
Payer Family Performance & Yield Matrix
Sample RCM audit report page: Revenue at Risk & Expected Recovery Model
Revenue at Risk & Expected Recovery Model
Sample RCM audit report page: Denial Command Center & CARC Diagnostics
Denial Command Center & CARC Diagnostics
Sample RCM audit report page: Unbilled Backlog & Bottleneck Analysis
Unbilled Backlog & Bottleneck Analysis
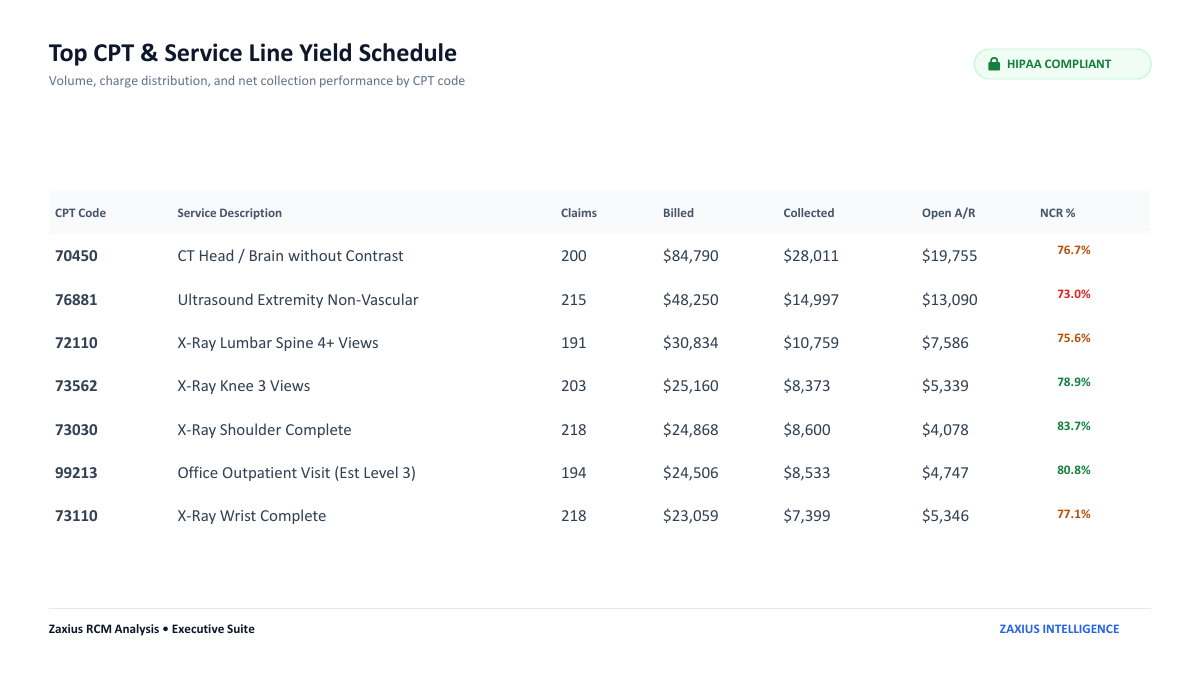
Sample RCM audit report page: Top CPT & Service Line Yield Schedule
Top CPT & Service Line Yield Schedule
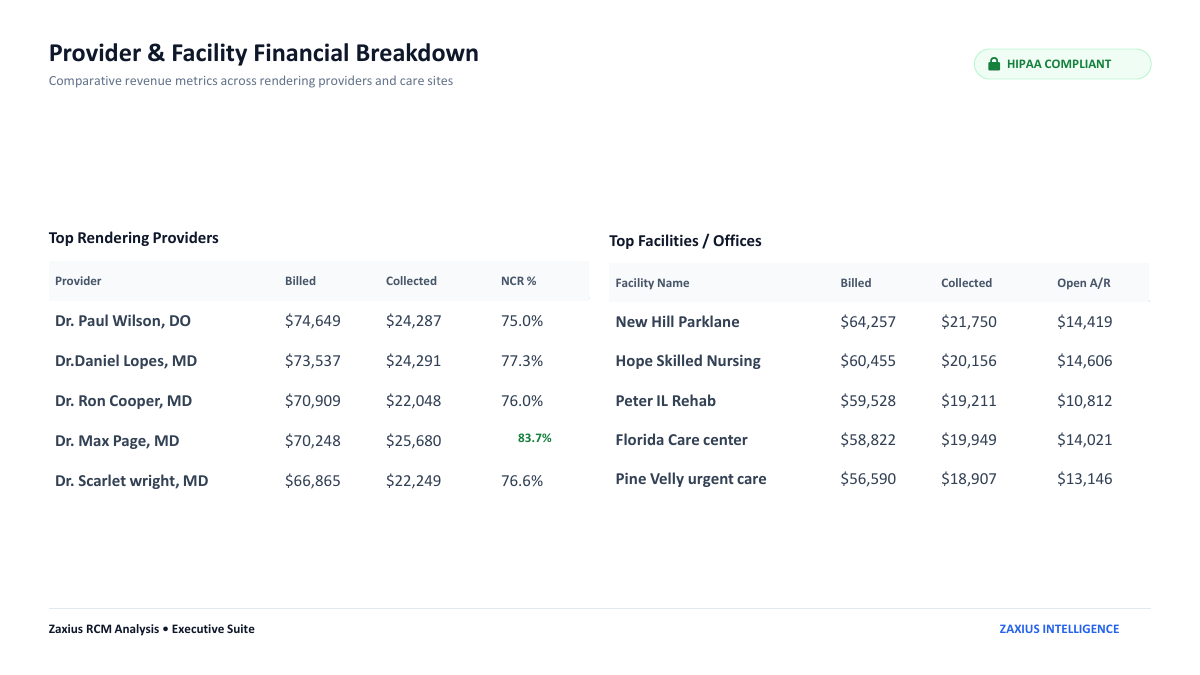
Sample RCM audit report page: Provider & Facility Financial Breakdown
Provider & Facility Financial Breakdown
Sample RCM audit report page: Strategic Revenue Recovery Action Plan
Strategic Revenue Recovery Action Plan
Sample RCM audit report page: RCM KPI Scorecard vs MGMA Benchmarks
RCM KPI Scorecard vs MGMA Benchmarks
Sample RCM audit report page: Closing - Transform Your Revenue Cycle
Closing - Transform Your Revenue Cycle
Sample from a de-identified engagement. Client-identifying details removed or generalized.

Want This Analysis on Your Numbers?

Send one billing export. We'll return your own 10-section executive audit — free, no obligation.

Get My Free AuditWhatsApp UsFree review · No setup fees
Free AuditChat on WhatsApp